Create a simple GUI tkinter to plot drilling data
I found myself creating a simple stand-alone desktop application using python GUI (Graphical User Interface) is very fascinating. To write a working code is one thing but to be able to create an interface using native elements in order for others to easily access is another new level. The challenge is to be able to switch the mindset from developer perspective into user, and how to conveniently incorporate the GUI code without losing focus on the main purpose of the program.
Depending on what the program would do. Most of the time I will use tkinter module to build GUI, however for a rather simple GUI application (when there is not much interface required), I would go for easyGUI module. The latter is eloquent, it comes with built-in function calls hence you write shorter code. For this blog, I have to use tkinter as it allows me to build checkbox options, but for another chance I will also write content on how to write a program with easyGUI.
import pandas as pd
import numpy as np
import matplotlib.pyplot as plt

#Need to register converters for datetime conversion purpose
from pandas.plotting import register_matplotlib_converters
register_matplotlib_converters()
import seaborn as sns
sns.set_style("whitegrid", {'axes.grid' : True})
import tkinter as tk
from tkinter import filedialog
from tkinter import *

root = tk.Tk()
# setting the windows size
root.geometry("800x600")

# declaring string variable for storing name and password
input_from_time = tk.StringVar()
input_to_time = tk.StringVar()
#input_excel = tk.StringVar()
var1= IntVar()
var2= IntVar()
var3= IntVar()

#Assign checkbox for each channel !Remember to declare the Var for ea.checkbox!
Checkbutton(root, text="Surface parameters plot", variable=var1).grid(row=11, column=0)
Checkbutton(root, text="Vibration Plot", variable=var2).grid(row=11, column=1)
Checkbutton(root, text="ECD plot", variable=var3).grid(row=11, column=2)

# defining a function and print them on the screen
def submit():
    from_time = input_from_time.get()
    to_time = input_to_time.get()

    label1= tk.Label(root, text=f"You are plotting interval {from_time} to {to_time}", pady=5)
    label1.grid(row=4, column=1)

def open_file():
    global filename
    filename= filedialog.askopenfilename(title="Open a file",initialdir="/", filetypes=[("Excel", "*.xlsx")])
    if filename is not None:
        print(filename)

    filename_label= tk.Label(root, text={filename}, pady=5)
    filename_label.grid(row=6, column=1)

def plot():
    df = pd.read_excel(filename, header=0)
    from_time = input_from_time.get()
    to_time = input_to_time.get()
    #Update the slicing location (Time-based YYYYMMDD)
    sliced_time = df[(df["DATETIME"] >= from_time) & (df["DATETIME"] <= to_time)]
    x = sliced_time["DATETIME"]
    x = pd.to_datetime(x).values.astype('datetime64[ms]')

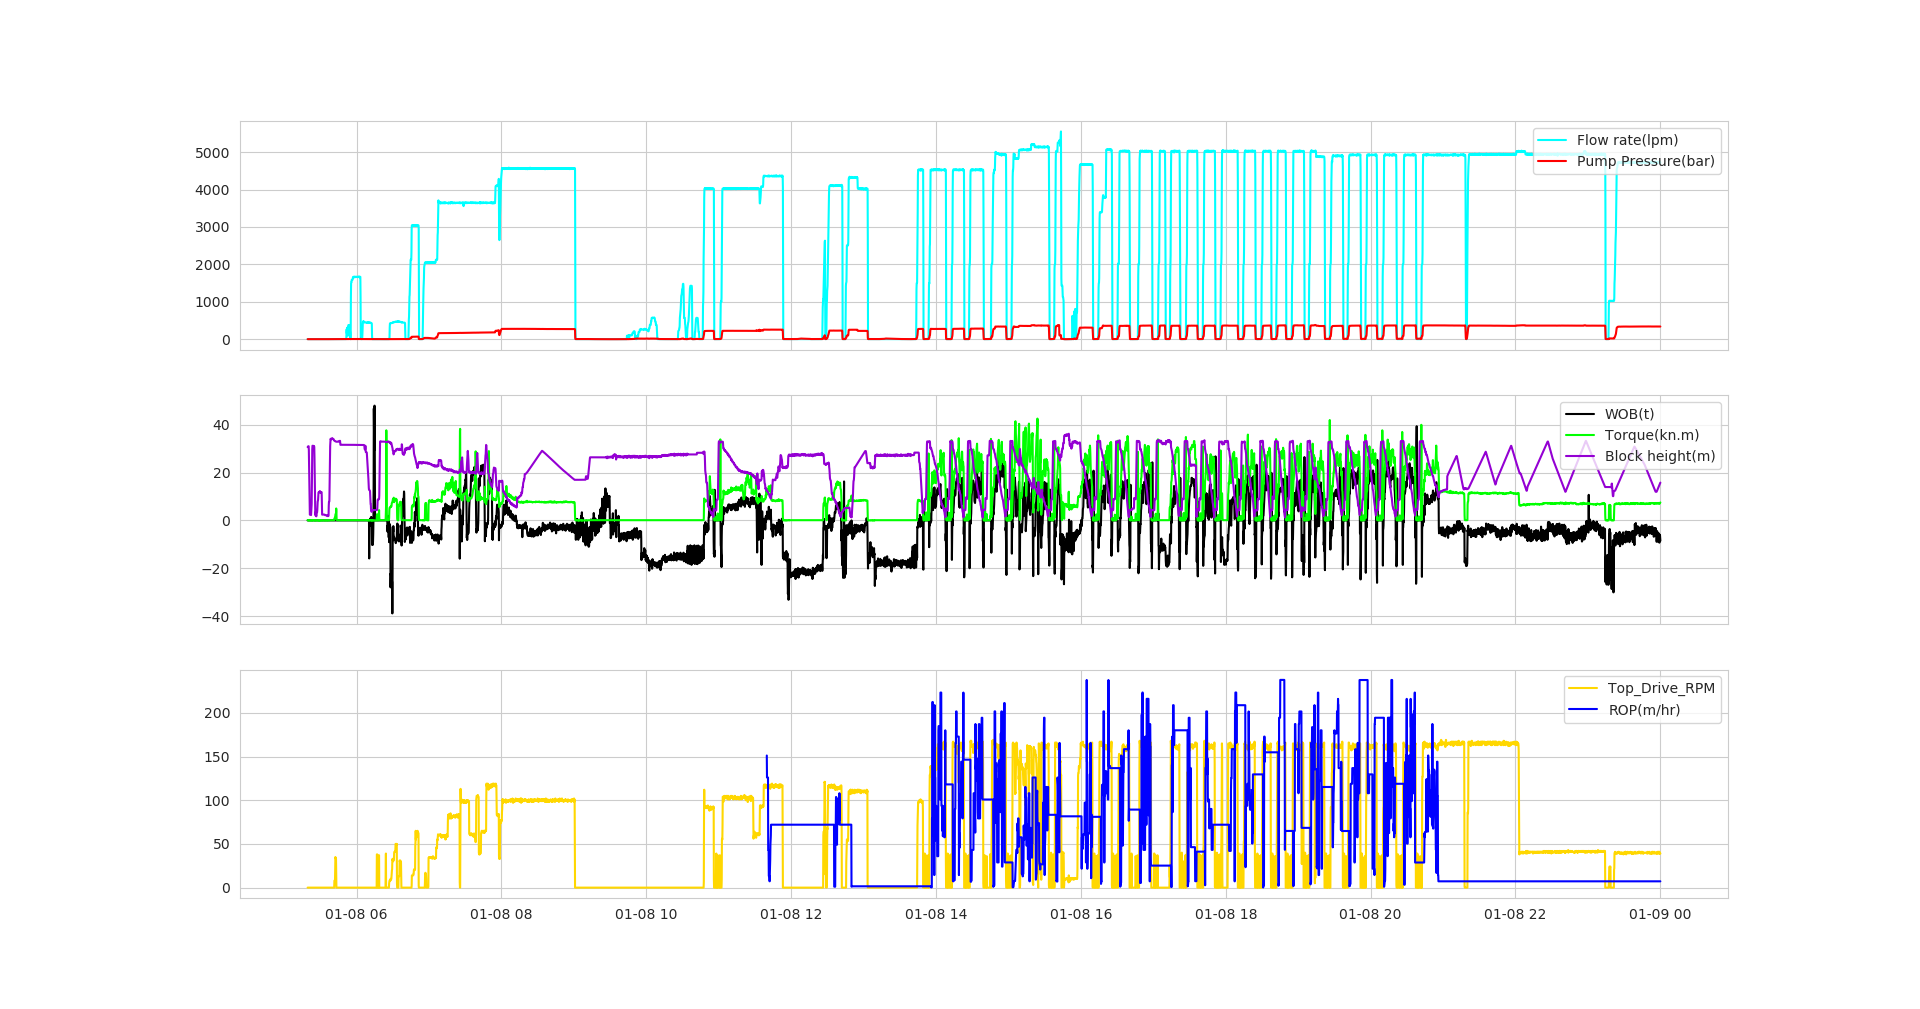
    if var1.get() == 1:
    #Start plotting
        fig, axs = plt.subplots(3, sharex=True)  # Share x-axis (Hole depth) to all subplots
        axs[0].plot(x, sliced_time["Flow_In_Rate"], color="cyan", label="Flow rate(lpm)")
        axs[0].plot(x, sliced_time["Pump_Pressure"], color="red", label="Pump Pressure(bar)")
        axs[2].plot(x, sliced_time["Top_Drive_RPM"], color="gold", label="Top_Drive_RPM")
        axs[1].plot(x, sliced_time["Bit_Weight"], color="black", label="WOB(t)")
        axs[1].plot(x, sliced_time["Top_Drive_Torque"], color="lime", label="Torque(kn.m)")
        axs[2].plot(x, sliced_time["ROP_-_Average"], color="blue", label="ROP(m/hr)")
        axs[1].plot(x, sliced_time["Block_Height"], color="darkviolet", label="Block height(m)")
        axs[0].legend(loc="upper right")  # Assign unique legend position
        axs[1].legend(loc="upper right")
        axs[2].legend(loc="upper right")
        plt.show()

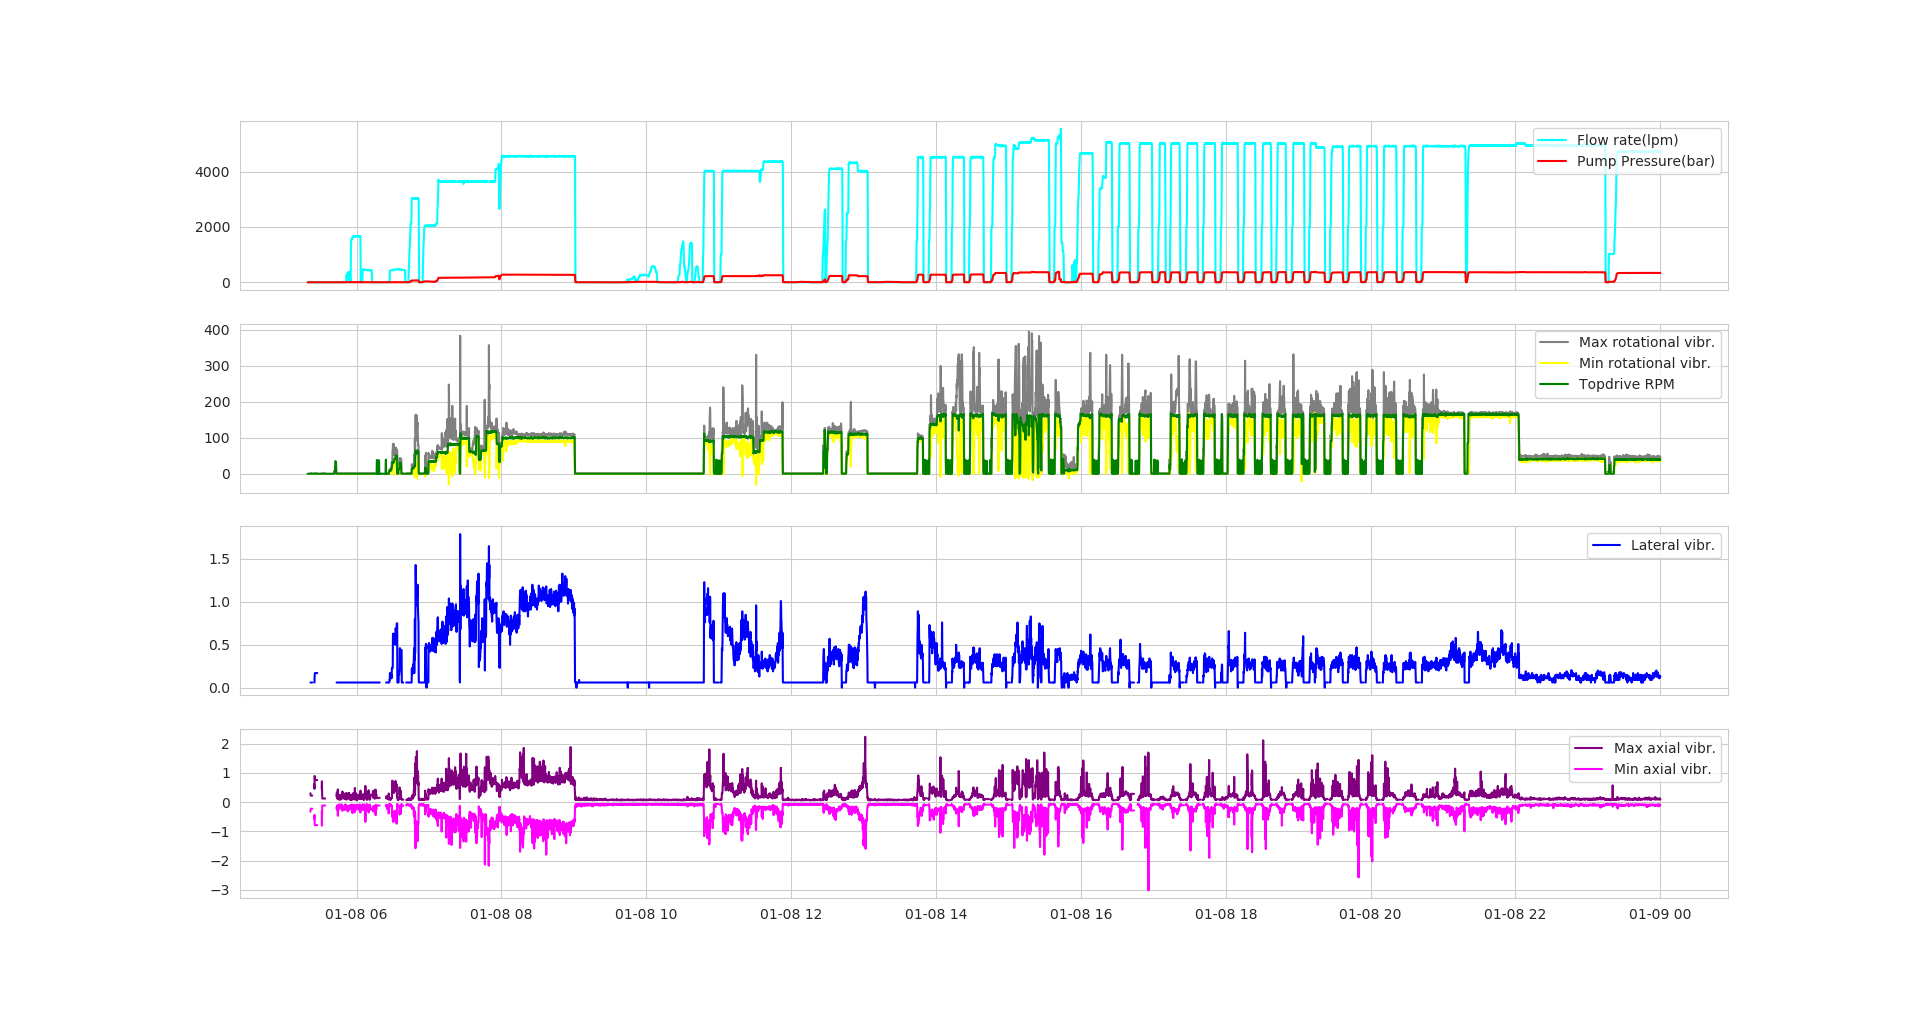
    if var2.get() == 1:
    #Start plotting
        fig, axs = plt.subplots(4, sharex=True)  # Share x-axis (Hole depth) to all subplots
        axs[0].plot(x, sliced_time["Flow_In_Rate"], color="cyan", label="Flow rate(lpm)")
        axs[0].plot(x, sliced_time["Pump_Pressure"], color="red", label="Pump Pressure(bar)")
        axs[1].plot(x, sliced_time["DHT001_Rot_Gyro_Max"], color="gray", label="Max rotational vibr.")
        axs[1].plot(x, sliced_time["DHT001_Rot_Gyro_Min"], color="yellow", label="Min rotational vibr.")
        axs[1].plot(x, sliced_time["Top_Drive_RPM"], color="green", label="Topdrive RPM")
        axs[2].plot(x, sliced_time["DHT001_Accel_Lat_Local_Stdev"], color="blue", label="Lateral vibr.")
        axs[3].plot(x, sliced_time["DHT001_Accel_Axial_Z_Max"], color="purple", label="Max axial vibr.")
        axs[3].plot(x, sliced_time["DHT001_Accel_Axial_Z_Min"], color="magenta", label="Min axial vibr.")
        axs[0].legend(loc="upper right")  # Assign unique legend position
        axs[1].legend(loc="upper right")
        axs[2].legend(loc="upper right")
        axs[3].legend(loc="upper right")
        plt.show()

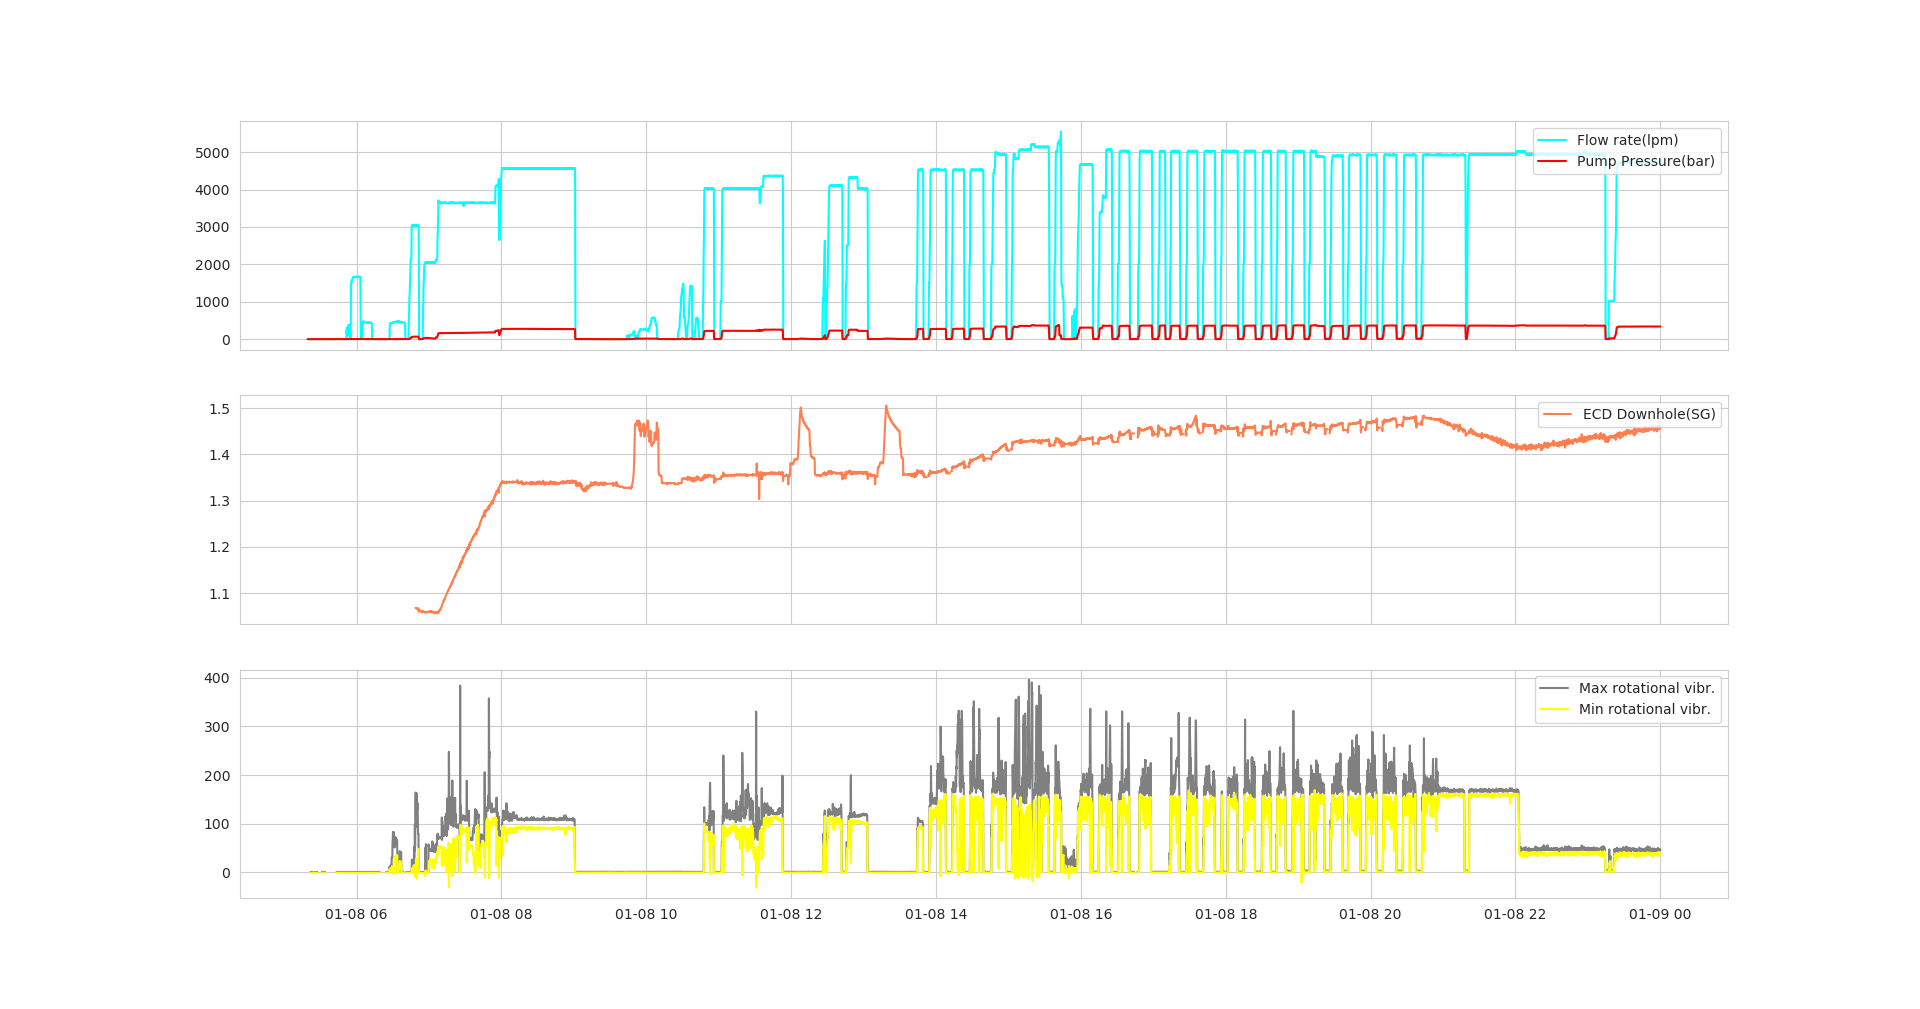
    if var3.get() == 1:
    #Start plotting
        fig, axs = plt.subplots(3, sharex=True)  # Share x-axis (Hole depth) to all subplots
        axs[0].plot(x, sliced_time["Flow_In_Rate"], color="cyan", label="Flow rate(lpm)")
        axs[0].plot(x, sliced_time["Pump_Pressure"], color="red", label="Pump Pressure(bar)")
        axs[1].plot(x, sliced_time["DHT001_EMW_RSC"], color="coral", label="ECD Downhole(SG)")
        axs[2].plot(x, sliced_time["DHT001_Rot_Gyro_Max"], color="gray", label="Max rotational vibr.")
        axs[2].plot(x, sliced_time["DHT001_Rot_Gyro_Min"], color="yellow", label="Min rotational vibr.")
        axs[0].legend(loc="upper right")  # Assign unique legend position
        axs[1].legend(loc="upper right")
        axs[2].legend(loc="upper right")
        plt.show()

    else:
        pass

# creating a label using widget Label
from_time_label = tk.Label(root, text='From time', font=('calibre', 10, 'bold'))
to_time_label = tk.Label(root, text='To time', font=('calibre', 10, 'bold'))
excel_label = tk.Label(root, text='Input Excel', font=('calibre', 10, 'bold'))

from_time_label2 = tk.Label(root, text='Use format YYYYMMDD<space>HHMMSS', font=('calibre', 10))
from_time_label3 = tk.Label(root, text='Eg. 20210108 053000', font=('calibre', 10, "italic"))

channels_list= tk.Label(root, text="Tick plot to display: ", font=("Silkscreen", 12, "bold"), pady=20).grid(row=10, column=0)

# creating an entry for input using widget Entry
from_time_entry = tk.Entry(root, textvariable=input_from_time, font=('calibre', 10, 'normal'))
to_time_entry = tk.Entry(root, textvariable=input_to_time, font=('calibre', 10, 'normal'))

# creating a button using the widget Button that will call the function
import_btn = tk.Button(root, text='Insert file', command=open_file)
plot_btn = tk.Button(root, text='Plot', command=plot)

# placing the label and entry in the required position using grid method
from_time_label.grid(row=0, column=0)
to_time_label.grid(row=1, column=0)
from_time_label2.grid(row=3, column=0)
from_time_label3.grid(row=4, column=0)
excel_label.grid(row=6, column=0)

from_time_entry.grid(row=0, column=1)
to_time_entry.grid(row=1, column=1)


import_btn.grid(row=15, column=0, sticky=tk.E, pady=8)
plot_btn.grid(row=16, column=0, sticky=tk.E, pady=8)

# performing an infinite loop for the window to display
root.mainloop()
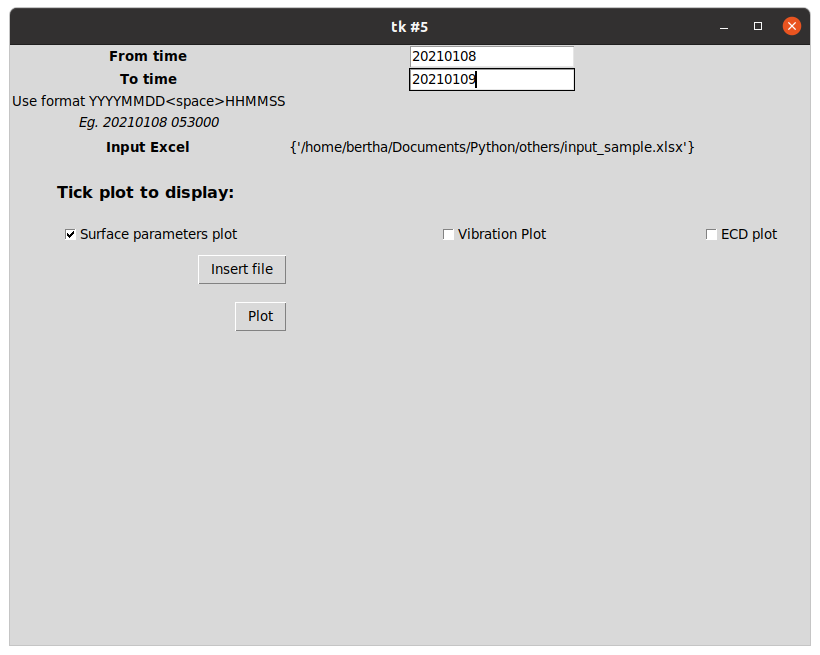
Here is how the GUI looks like when you run the script:


With the code above, feel free to adjust the scale of the channels, as well as the number of rows/columns that you wish. This tutorial is intended to just provide a brief explaination on how to plot a basic graph. I also have attached an example of the excel input template that is compatible for the script. Happy trying!
